Real Time Survey Updates
**Page In Development
Real Time Survey visualizations are available on the RPubs website.
Contact Kevin Stierhoff for access.
plotSurvey
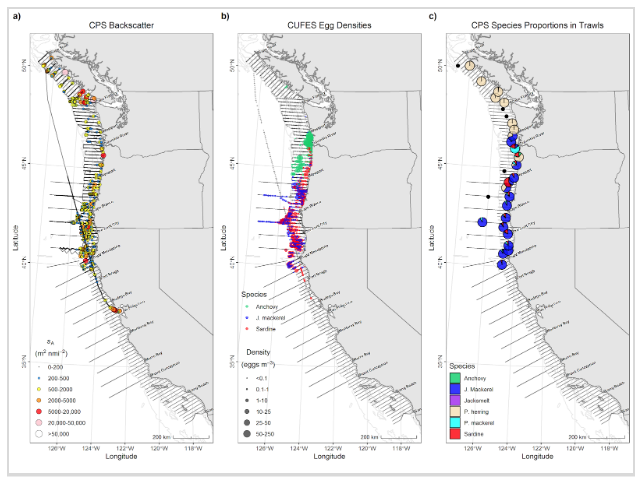
plotSurvey is an R-based tool in the estimATM repository used to visualize preliminary trawl and acoustic backscatter data. Visualizations are critical for not only for you and others on the ship for decision making and error checking, but the results will be also be available for folks ashore. plotSurvey is in the estimATM Doc folder, as it is an .Rmd file.
Once configured properly, files used by plotSurvey are automatically copied to the appropriate locations using SyncBack. If recent changes have been made to the trawl database, manually run the SyncBack profile on the Chem Lab Trawl PC to collect the most recent data (we could not map to the Trawl PC from the EV PC, but we could map in the opposite direction). plotSurvey produces all of the interactive and static figures.
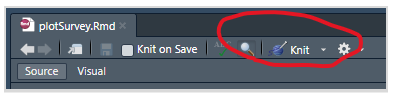
Any of the tools described below can be run by making plotSurvey.Rmd the active tab, then “knitting” the file (i.e., pressing “Knit”):
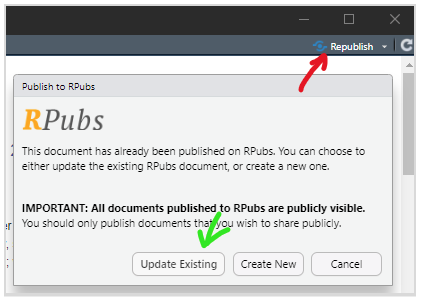
You can publish the output from plotSurvey to Rpubs by pressing the Publish/Republish button in the upper right of the Rstudio Browser:
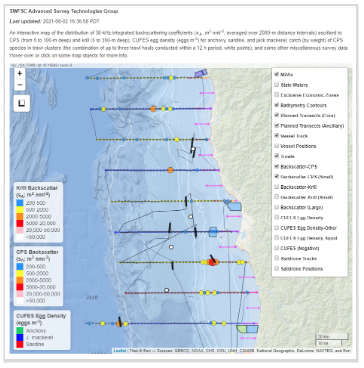
The result is a GIS-like interactive map that may be viewed in a web browser.
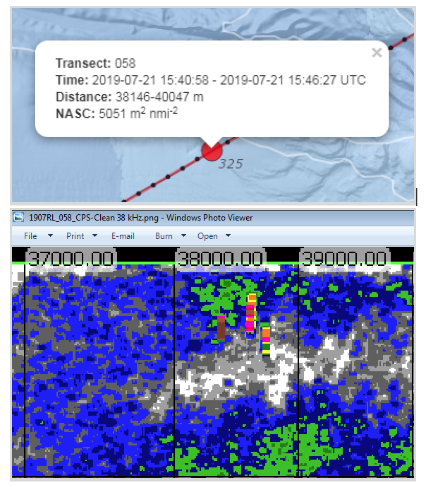
One useful addition is the ability to match the backscatter from interactive plotSurvey maps with exported echograms. Clicking on summarized acoustic points shows a popup that contains the time and distance interval over which those data were summarized, allowing you to scrutinize the results of Echoview processing. Make sure to cross-reference your backscatter spots on plotSurvey with the exported image from Echoview to make an informed trawl-location decision. For example:
Further, figures that are included in reports and Weekly Updates are created here:
C:\SURVEY\2506SH\ANALYSIS\2506SH\Figs, for example:
checkTrawls
Trawl data is examined using checkTrawls.Rmd. This tool looks for missing data and input errors in the trawl database by mapping trawl paths and comparing length-weight data to historic growth models (from Palance et al. 2019), and also identifying specimens with extreme condition factors (K, ~L/W3), indicating an erroneous length or weight value.
It’s recommended to run checkTrawls daily and then report suspected errors to the trawl data entry person for review and correction. The Trawl PC in the Chem Lab is running a SyncBack profile that will obtain the output from checkTrawls. Errors that can later cause problems in the biomass estimation, such as measuring the FL instead of SL for anchovy or sardine, can be caught early and corrected.
plotCTD
Processed CTD and UCTD casts can be scrutinized and visualized using plotCTD.Rmd. The results include cast summary tables (depth, deployment time, location), location maps, and interactive profiles of temperature and salinity, and for UCTD casts, descent rate, depth vs. time (for estimating deployment times), and sound velocity.
It is not necessary to run this, but you may find it informative to monitor and predict deployment times, water column properties, or easily identify casts that have not yet been processed to create ECS files (e.g., .asc files with no corresponding -results.txt file get identified for processing).
Updating and bug fixing
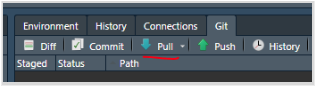
Before running, it is helpful to apply any recent updates/bug fixes by pressing “Pull” in the Git tab (upper right of the Rstudio GUI):
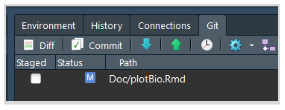
(If you get an error message, right-click plotSurvey.Rmd file in the Git panel, or any other files that show-up there, and select “Revert”, then Pull again. This will discard any changes made on the ship and apply the latest updates from Github.)
If you’d like further instructions/assistance, or encounter any errors, or would like to request any improvements or changes, please contact Kevin.